Industry Update – Week of May 8, 2023
US West Coast Labor Update:
- The Journal of Commerce reported on May 3, 2023:
- An agreement was reached on May 3rd regarding manning requirements for non-automated terminals. This was a major hurdle in contract talks.
- Next steps for the PMA/ILWU will be to work on two more major issues which remain to be settled – wages and pension benefits.
- Various ‘job actions’ which have affected operations at U.S. West Coast ports have ceased. Both parties are optimistic an agreement could be reached soon. Sources indicate a ratification vote is possible by mid-summer.
Panama Canal Authority – Lowers Maximum Draft
According to gCaptain, “Effective April 19, 2023, the maximum authorized draft for vessels transiting the Neopanamax locks has been set at 14.48 m (47.5 feet) Tropical Fresh Water (TFW). Further reductions will take effect on April 27, May 5, and May 12, bringing the maximum authorized draft to 14.02 m (46.0 feet) TFW.” These restrictions will apply to the Neopanamax locks. Vessels must adhere to the regulations and are warned they could impact transit times.
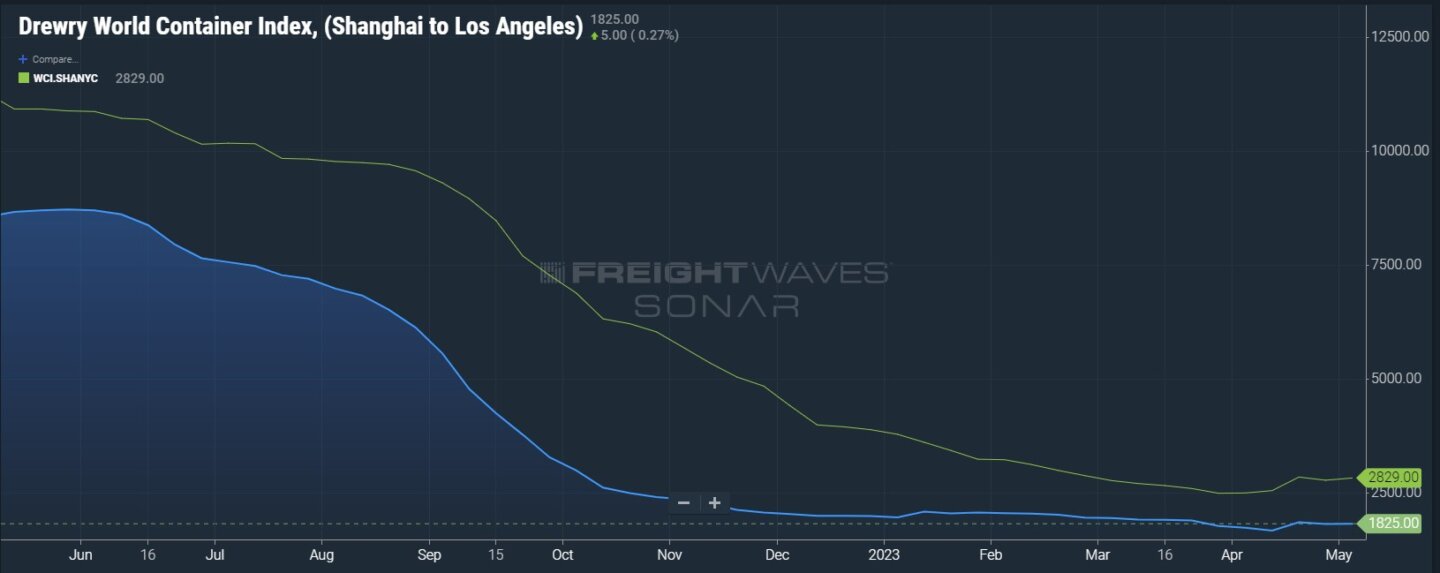
U.S. Market Update: charts courtesy of Freightwaves SONAR
- Ocean: Chart below illustrates past 1 year 05/08/22 – 05/08/23 of rate fluctuation SHA to LAX and SHA to NYC
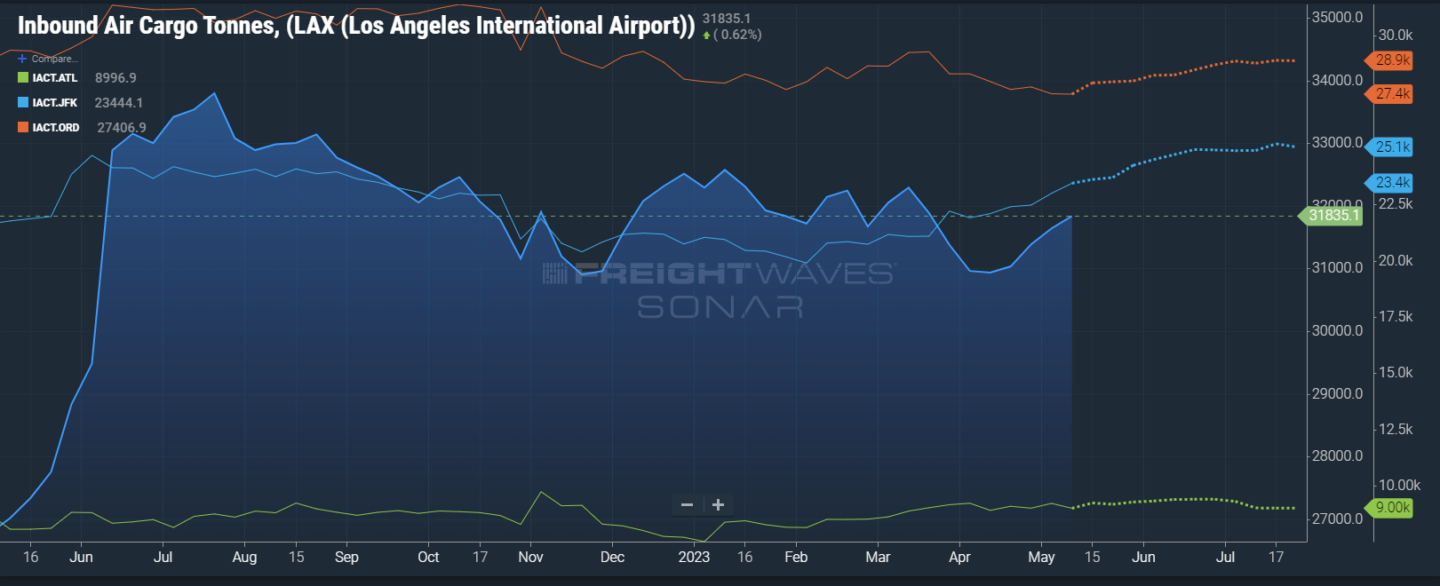
Air: Below chart illustrates past Inbound Air Cargo Tonnes: 1-year (05/08/22 – 05/08/23) rate movement. Dotted line illustrates next 7 days out based on predictive booking. LAX JFK ATL ORD
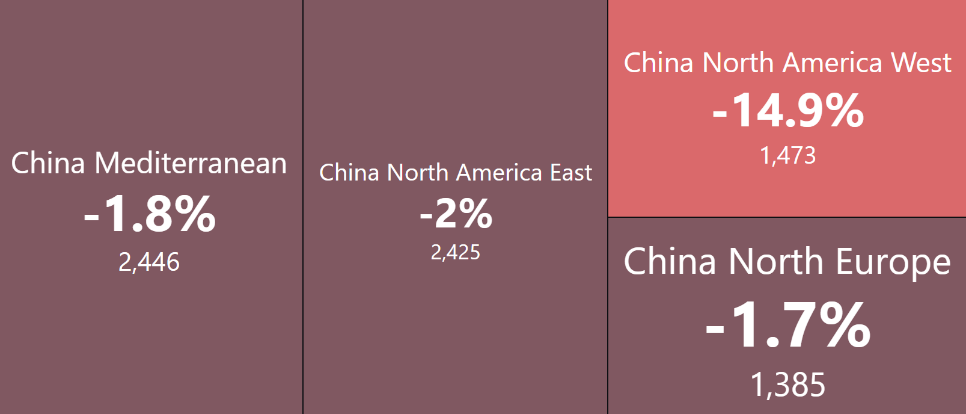
40’ Container Rate Index Movement
Chart illustrates the percentage of change in rate up/down for the past 2 weeks along with the Value (rate level based on regional international trade data. The Freightos Baltic Daily Index measures the daily price movements of 40-foot containers in 12 major maritime lanes. It is expressed as an average price per 40-foot container.
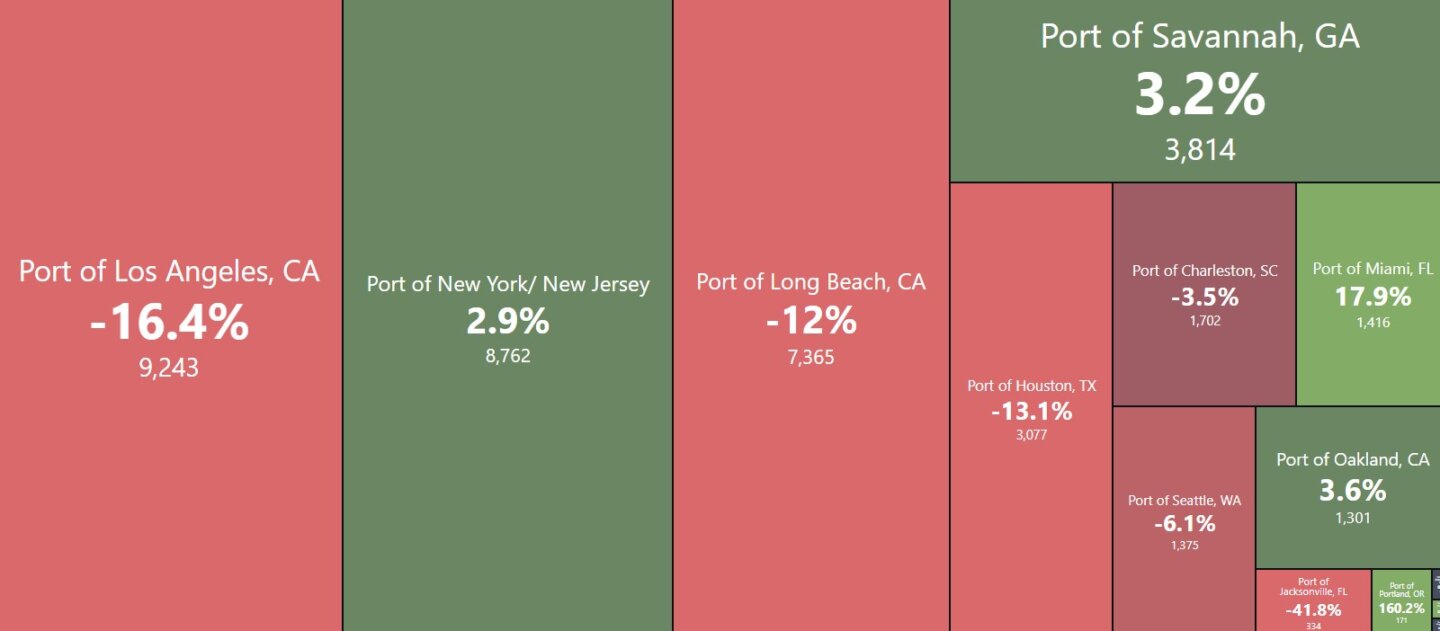
US Ports Update: Chart illustrates the percentage of increase/decrease in volume for that port month over month. The whole number indicates the total number of import shipments (containerized and non-containerized).